

11.6 服务调用树
服务调用树可以帮助我们更好地了解服务间的调用关系,并优化服务间的调用关系,减少服务间不需要的依赖关系,从而使应用更稳定。Istio默认情况下使用ServiceGraph根据Prometheus中存储的指标数据来绘制网格内服务调用树。
【实验】
1)查看是否部署了Prometheus:
$ kubectl get deploy prometheus -n istio-system
NAME          DESIRED       CURRENT           UP-TO-DATE     AVAILABLE   AGE
prometheus    1             1                 1              1           21d
$ kubectl get svc prometheus -n istio-system
NAME          TYPE          CLUSTER-IP        EXTERNAL-IP    PORT(S)     AGE
prometheus    ClusterIP     10.99.177.169     <none>         9090/TCP    21d
上面的命令结果表示Prometheus已经部署。
2)查看是否部署了ServiceGraph:
$ kubectl get deploy servicegraph -n istio-system
NAME          DESIRED       CURRENT           UP-TO-DATE     AVAILABLE   AGE
servicegraph  1             1                 1              1           21d
$ kubectl get svc servicegraph -n istio-system
NAME          TYPE          CLUSTER-IP        EXTERNAL-IP    PORT(S)     AGE
servicegraph  ClusterIP     10.101.107.109    <none>         8088/TCP    21d
如上的命令结果表示ServiceGraph已经部署。
3)创建用于请求的Pod:
$ kubectl apply -f kubernetes/fortio.yaml
4)暴露ServiceGraph的Web服务:
$ kubectl apply -f kubernetes/istio-servicegraph-service.yaml
5)并发请求服务:
$ kubectl exec fortio -c fortio /usr/local/bin/fortio -- load -curl http://service-python/env
HTTP/1.1 200 OK
content-type: application/json
content-length: 178
server: envoy
date: Fri, 18 Jan 2019 14:41:18 GMT
x-envoy-upstream-service-time: 2621
{"message":"python v1","upstream":[{"message":"lua v2","response_time":0.03},{"message":"node v2","response_time":0.1,"upstream":[{"message":"go v1","response_time":"0.02"}]}]}
$ kubectl exec fortio -c fortio /usr/local/bin/fortio -- load -qps 10 -n 100 -loglevel Error http://service-python/env
14:46:20 I logger.go:97> Log level is now 4 Error (was 2 Info)
Fortio 1.0.1 running at 10 queries per second, 2->2 procs, for 100 calls: http://service-python/env
Aggregated Sleep Time : count 96 avg -14.174398 +/- 9.139 min -31.539875778 max -0.121480823 sum -1360.74219
# range, mid point, percentile, count
>= -31.5399 <= -0.121481 , -15.8307 , 100.00, 96
# target 50% -15.996
WARNING 100.00% of sleep were falling behind
Aggregated Function Time : count 100 avg 1.5912442 +/- 1.105 min 0.011235438 max 4.197832121 sum 159.124416
# target 50%   1.17647
# target 75%   2.52381
# target 90%   3.38462
# target 99%   4.09892
# target 99.9% 4.18794
Sockets used: 6 (for perfect keepalive, would be 4)
Code 200 : 98 (98.0 %)
Code 503 : 2 (2.0 %)
All done 100 calls (plus 0 warmup) 1591.244 ms avg, 2.4 qps
6)创建Web访问的路由规则:
$ kubectl apply -f istio/route/gateway-js-v1.yaml
7)浏览器访问。访问地址http://11.11.11.112:31380/ ,多次刷新并点击“发射”按钮。
8)在ServiceGraph UI上查看服务调用树。访问地址http://11.11.11.111:32145/force/forcegraph.html ,查看服务调用树,如图11-22所示。
访问地址http://11.11.11.111:32145/force/forcegraph.html?timehorizon=15m&filterempty=true ,查看最近15分钟内的服务调用树,如图11-23所示。
9)清理:
$ kubectl delete -f kubernetes/fortio.yaml
$ kubectl delete -f istio/route/gateway-js-v1.yaml
$ kubectl delete -f kubernetes/istio-servicegraph-service.yaml

图11-22 在ServiceGraph UI上查看服务调用树
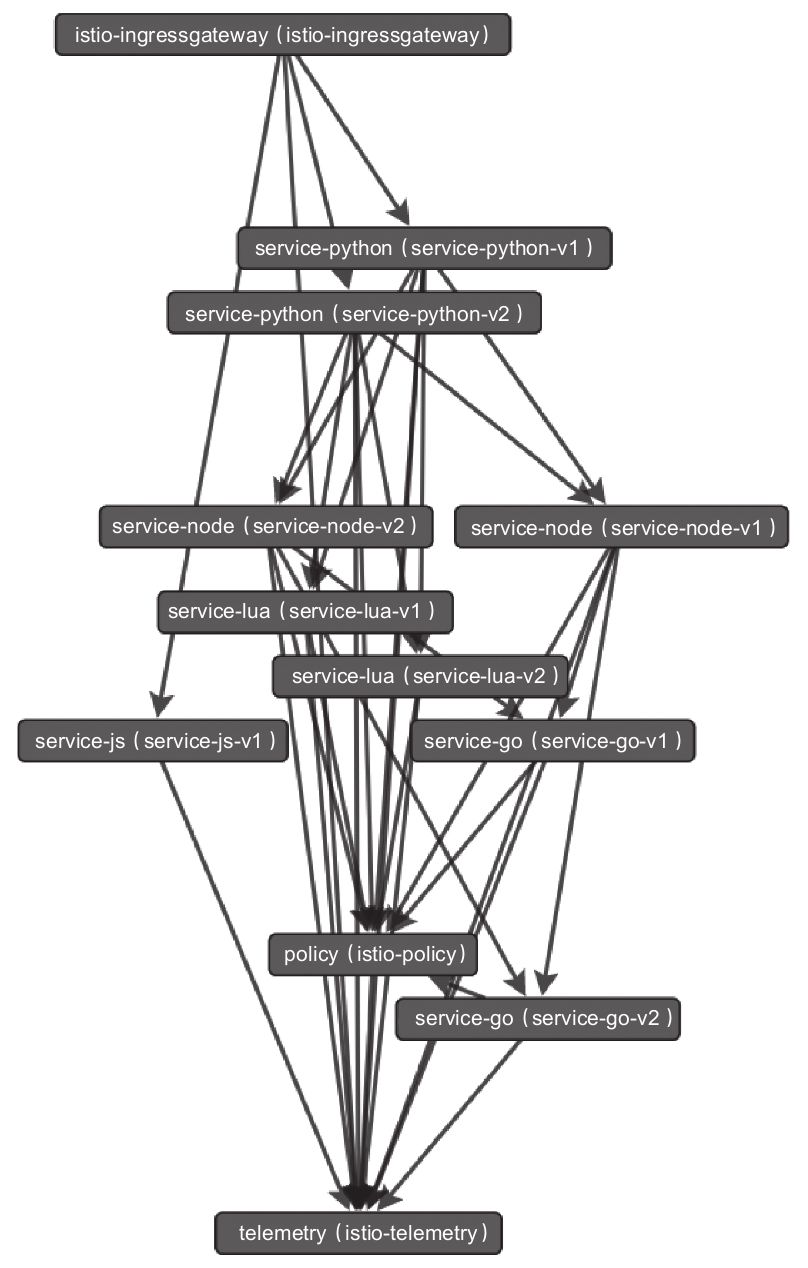
图11-23 最近15分钟内的服务调用树